Showing posts with label Forex Signal. Show all posts

Tuesday, July 05, 2011

GBPUSD Analysis


There is a good chance that cable had completed another minor correction phase from its last impulse wave. First target is around 1.5864 which is the 100% projection of 1.6744 to 1.6058 from 1.6546. Longer term projection is around 1.5445 which is the 161.8% projection. As for risk assessment, a break above 1.6100 will change my view regarding this trend continuation.


Monday, October 18, 2010

GBPJPY: Dying To See A Hammer


After gaining against JPY for 2 days, pound sterling started to give it all back. The current rate is 129.54 with support trendline at 129 area. As I said in my previous post, there is no sign for a reversal, yet. Meaning, I'm dying to see a hammer or at least a long lower shadow/tail/wick on daily chart on the following days. No no no.. the hammer wouldn't be my buy signal, just a first signal for a bullish movement. The price should close above 130.70 to confirm the hammer. Now you might think that confirmation would be my buying signal. Well, false again. But we almost there. After closing above 130.70 area, the pair should retrace right? That would be my buying signal. Now, lets wait for that moment to happen.

Friday, September 03, 2010

USD/CHF Near Support Trendline


Above is USD/CHF weekly chart. The pair is very close to touch the rising trendline connecting 2 previous extreme lows. I'm expecting candle reversal pattern over the next few weeks. Risk should be limited below the trendline, now at 1.0020/40 (about 115 pips from current price). The best thing about this setup, obviously, is the potential return.
There are so much room upside for this pair (1000 pips or more). If the trend does reverse, the likely target is the falling trendline connecting the highs. And, who knows..there might be a break above the resistance trendline ;)

Thursday, September 02, 2010

AUD/USD Target Reached


The pair reached target at 0.9078 and correction is expected (see previous AUD/USD post). First target is around 0.9026 and 0.8965 (near trendline) next. Stop should be above the previous high around 0.9115.

GBP/JPY Hidden Divergence


The pair did not bounce on the broken resistance and reach 129.16, about 35 pips from the previous low. Stochastic indicator shows hidden divergence at this current low, which mean a bullishi signal. Stop remains around 128.70/80, while target is around 131.12 and 131.65 next. Important high is at 133.59, therefore the pair might test that level if the bull is strong.

Sunday, August 29, 2010

AUD/USD Bullish Possibility


The pair broke the trendline on Friday and the bullish mode is on for tomorrow. The range of the last wave (CD) already match with AB and we might see a return move to the breaking point of the trendline. I am expecting the same correction size as BC, although it might be longer this time. Risk should be limited above 0.8860, so try to enter as near as possible to that level. Or, enter above 0.9000 and look for 0.9050 area, after we see the correction phase. Have a nice weekend!

Thursday, July 29, 2010

Continue or Reverse?


Check out this falling wedge on GBPJPY H1 chart. Wait for a breakout to confirm the completion of the pattern. Break on the upside or above 136.53 should trigger buyers and the pair may test the resistance around 137.30 area. Break on the other side or below 135.86 should indicate further correction to this uptrend.

Tuesday, July 13, 2010

Try Long USD/CHF


USD/CHF has fallen for more than 800 pips since the last signal on June 6th. Honestly, I was expecting more swings in this bearish movement. Nevertheless, it has reached the support around 1.0500 and I prefer a long position from here. Target is near the broken support trendline or 1.0895 area. But first USD/CHF must break 1.0750 area. Stop loss area is below the previous low around 1.0477/90.

Wednesday, June 09, 2010

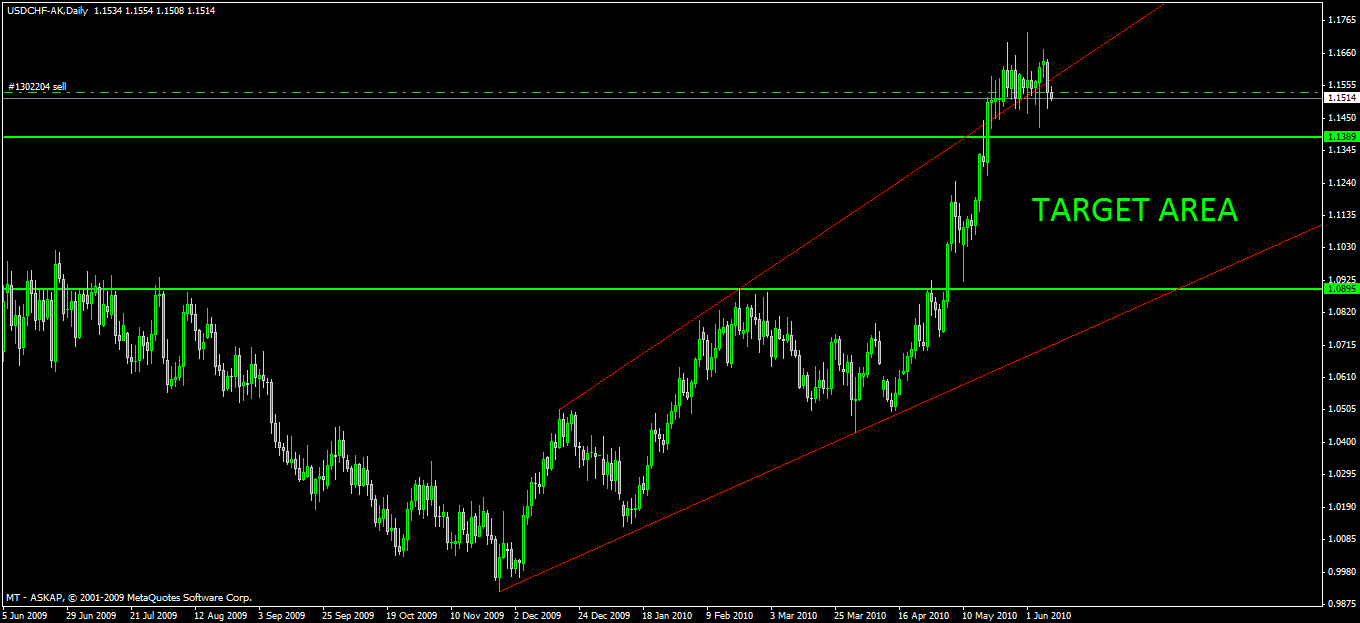
USD/CHF Short Signal


I have been watching this pair for several days now waiting for this moment. The pair has move back inside the trendlines and I have entered short position at 1.1532. If 1.1728 is the top of the fifth wave, then we should see A-B-C corrective waves. I calculate minimum and maximum movement for this and got 2 lines there (see pic). Between those lines is our target area. That is all guys. Happy pippin!

Tuesday, May 18, 2010

Fight The Trend! Go Long!


Hi there, I bought EUR/USD, EUR/JPY, and GBP/JPY earlier at 1.2336, 113.99, and 133.43 respectively. I know that the trend is still down and honestly, I'm a bit worry about these entries ;P

Nevertheless, EUR/USD has finished 100% of the previous impulsive wave and another correction could be in progress toward 1.2800 area. EUR/JPY still in the1-week down channel. Break of this channel should confirm 112.45 (yesterday's low) as support. I target 124 area for EUR/JPY. For my baby GBP/JPY, I target 135 and 137 area. Please be good GJ..

Thursday, April 29, 2010

USD/CHF: Keep On Selling


Above is USD/CHF daily chart which showed my chart setup for USD/CHF. I shorted the pair again targeting 1.0717 level near 50% retracement of 1.0501 to 1.0923. The stop loss level is above the 1.0923 level. I also add a blue channel there based on the last three waves. Okay that is all for now. Happy trading!


Friday, April 23, 2010

USD/CHF: Sell Now


I just shorted USD/CHF near the trendline resistance. I think its a pretty good chance for another swing down to the support trendline. I opened 3 positions with 50 pips target for the first position and gonna leave the target open for the rest positions. Okay thats all and this is probably my last trades for this week..probably.. :P

Tuesday, April 20, 2010

EURUSD: Buy Now


Hi guys! I have just finished my setup for EUR/USD. Yesterday, the pair found support around 1.3433 and closed above the daily open price. I have bought the pair at 1.3467 but break of 1.3481 on hourly chart is my confirmation for another swing to test the falling trendline (red dot). As for risk, I'll cut loss if the pair break below 1.3430.

In bigger view, EUR/USD has finished 5 waves down from 1.5143 with low at 1.3266 before forming a double bottom pattern. However, the bearish view remains as long it stays below 1.3815 resistance, while break of the low may bring EUR/USD to the neckline on weekly chart.

Sunday, March 28, 2010

GBP/USD H4 and Daily Chart, Buy Now


My setup from my previous post didn't play right although the pair did made a lower low. Cable tested the 1.4781 support and reached as far as 1.4797. On daily chart, the candlestick make a reversal pattern (forgot what they call that pattern :P) and still forming a divergence in both 4-hour and daily chart. However, confirmation for uptrend in 4-hour time frame is above 1.5381. If you aggressive enough, you can buy now with stop loss below 1.4781, targeting 1.5381 first and 1.5581 (38.2% retracement of 1.6877 to 1.4781) after that. That is all. Have a nice weekend guys!

Monday, March 22, 2010

GBP/USD H4, Sell Below 1.4976


Above is Cable 4-hour chart. The pair broke the rising trendline and testing 1.4976 level at the moment. I'll keep my short position as long this level remain intact. Support suppose to be around 1.4872 (March 10th low). Ok thats all. Have a nice day guys!

Sunday, March 21, 2010

GBP/JPY Break H4 Trendline


The pair reach 61.8% retracement of 143.59 to 132.00 at 139.16. It reversed since and made a nice bearish candle on weekly chart. It also break H4 trendline and the pair might continue the down trend. Support levels can be seen around 135.16 first and 133.88 next before testing 132.00. As for risk, I think 38.2 level (136.43).

Tuesday, March 16, 2010

GBP/JPY at 61.8% Retracement, Buy Signal


So the pair fail to break 137.80 and reach 61.8% retracement (135.50) near the support trendline. There are no signs of reversing yet but I already put my buy limit order :P Nevertheless, it seems like a good price to enter long. My stop loss is below 134.90. The target should be the resistance trendline again near 137.80 but I'm only going to take 40-50 pips.

Saturday, March 13, 2010

GBP/JPY Reach Target


This is an update from my last post. The pair has reached target at 137.80. The trend in hourly is still bullish but I would wait a break above that 50% Fib level to confirm another move up. Another resistance is around 139.16 which is 61.8% Fib level. On the other hand, GBP/JPY might go down to the support channel again or look for 50% to 61.8% retracement (between 135.5 and 136.00).

Friday, March 12, 2010

GBP/JPY Update


The retracement from Friday reach 61.8% and formed a double bottom. It has been moving up since. First target it the 50% level of the 5-wave down from 143.59 to 132.00 at 137.80. Stop loss around 136.

Sunday, March 07, 2010

GBP/JPY, GBP/USD, and EUR/USD Update

These are the update for GBP/JPY, Cable, and EUR/USD from my last tweet about chart setup.


The pair finally break a side after going sideway since it reach 132.00 low. I missed the first breakout of 134.02 but luckily I got another opportunity. The pair reached 2nd target (which is also the neckline) after NFP data released. I think we'll see corrective movement in hourly next week before it reach 50% fibo level (137.80). Otherwise we'll see a reversal signal and we can start selling the pair again ;)


GBP/USD
Cable still moving inside the corrective channel, suppo
rt by 1.5000 level. I think we can still targeting the 50% fib level around 1.5300 next week. I have closed my position yesterday along with my GBP/JPY position. So I think I'm going to wait for a dip near the support channel before buying this pair.


EUR/USD
The euro still moving between 50% and 61.2% Fib level. I am just going to stay out of this pair until a significant break occurs.