Following my last post on GBPJPY titled 'what if', the pair had tested 135 level before turning back to its previous level. Current rate for this pair is 129.38, which is also at the support trendline. So far, there is no sign of reversal. Nonetheless, the price did find some support in this area. I would suggest a neutral view, with a possibility to rise further to the upper trendline. Closing below previous bottom would trigger bearish view. Other than that, the scenario for 141.20 area is still in play.

Above is GBPJPY weekly chart. The pair depreciates again earlier today and bounced near 128.50. I drew three trendlines showing forecasted support and resistance. Now, let's imagine. What if this is where the fall since August last year ends? What if the price fail to break trendline number 1 and the last bottom at 126.73 will not be touched? What if this is where the uptrend starts? What if it reaches 139.xx in December? What if it continue to rise to 160.xx next year? By the way that is around 3050 pips from current price :p
But what if I'm wrong??? ;))

Above is USD/CHF weekly chart. The pair is very close to touch the rising trendline connecting 2 previous extreme lows. I'm expecting candle reversal pattern over the next few weeks. Risk should be limited below the trendline, now at 1.0020/40 (about 115 pips from current price). The best thing about this setup, obviously, is the potential return.
There are so much room upside for this pair (1000 pips or more). If the trend does reverse, the likely target is the falling trendline connecting the highs. And, who knows..there might be a break above the resistance trendline ;)

The pair reached target at 0.9078 and correction is expected (see previous AUD/USD post). First target is around 0.9026 and 0.8965 (near trendline) next. Stop should be above the previous high around 0.9115.

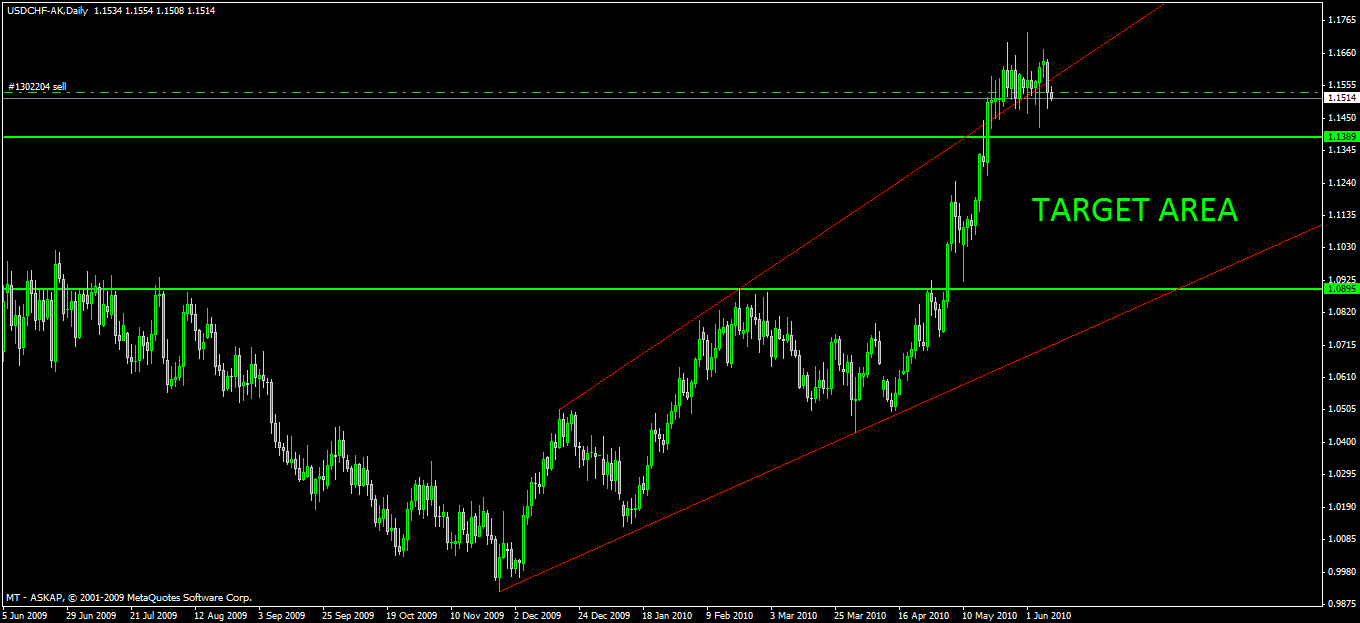
I have been watching this pair for several days now waiting for this moment. The pair has move back inside the trendlines and I have entered short position at 1.1532. If 1.1728 is the top of the fifth wave, then we should see A-B-C corrective waves. I calculate minimum and maximum movement for this and got 2 lines there (see pic). Between those lines is our target area. That is all guys. Happy pippin!

Above is USD/CHF daily chart which showed my chart setup for USD/CHF. I shorted the pair again targeting 1.0717 level near 50% retracement of 1.0501 to 1.0923. The stop loss level is above the 1.0923 level. I also add a blue channel there based on the last three waves. Okay that is all for now. Happy trading!


I just shorted USD/CHF near the trendline resistance. I think its a pretty good chance for another swing down to the support trendline. I opened 3 positions with 50 pips target for the first position and gonna leave the target open for the rest positions. Okay thats all and this is probably my last trades for this week..probably.. :P


GBP keep on gaining against Yen after a reguler-hidden divergence combination on hourly chart. At the moment, GBPJPY is facing the resistance trendline but still maintain above 144.70 level. Further pull back may be seen until 144.00/30 area. 4-hour resistance trendline is now around 146.50, but 145.50 area is enough for me ;P

Above is Cable 4-hour chart. The pair broke the rising trendline and testing 1.4976 level at the moment. I'll keep my short position as long this level remain intact. Support suppose to be around 1.4872 (March 10th low). Ok thats all. Have a nice day guys!


The pair has reach the target mentioned in previous post and found support at 1.3582. The pair retrace back to 1.38 since the open of this week market. It has not been clear yet of the retracement pattern this time, but I think the down trend ain't over just yet. On daily chart above, we can see that 1.3800 area was a serious support level around June last year, and even at weekly chart we can see a clear break from 1.3800. First target is the 61.8% retracement of 1.2457 to 1.5144 at 1.3483. You can see other levels in the chart above.

The pair has retraced 23.6% of 139.26 to 149.14 at 146.81. There are several support level here, broken trendline and 38.2% level of 118.80 to 163.06 (blue Fib) at 146.16. Break of these support levels should target 50% and 61.8% level. On the upside, first resistance is the falling trendline before testing 149.14 high.

Above is GBP/JPY 4 hour chart. It is pretty much the same with the one from the previous post. As expected, the pair went to 143.74 and tested 141 support again. However, it failed to break 141 area and reversed instead. The pair broken several resistance and now near 113% (yellow Fib) following the US unemployment release on Friday. Break of 113% (149.38) could bring the pair up to 23.6% level of 118.80 to 163.06 at 152.62. Failure to break this trendline could bring retracement to 146.20 area first, but I'll update on this since we don't see any sign of the top.
GBP/USD
Cable had a perfect negative correlation with GBP/JPY after the NFP release. The pair broke the support trendline and reached 1.6430 (38.2% level) before closing the week at 1.6474. I expect another ranging moves between that S/R lines (see chart) next week, at least until UK interest rate announcement.


After making a higher high from the previous week and formed double top formation, Cable broke the trendline/target from my previous post and touched 5th Nov low before closing at 1.6500. I think the pair will definitely test this month low at 1.6261 near 50% Fib level and the another support trendline.
Entry
I am anticipating 2 scenario of retracement toward the broken trendline: a lower low to 38.2% level at 1.6430 first or straight retracement to test the broken trendline near 23.6% level at 1.6601. The third scenario is a smooth move to 1.6300 area. So, I will enter short near 1.66 if Cable retrace or below 38.2% Fibonacci at 1.6430, 70 pips from current price.

The Pound lose against the Yen to 147.31, following the triangle break and 148.40 support. My key support level is around 146.46/74 (near 50% level of 139.70 to 153.22), which is my target for current position. Next target is the rising trendline from daily chart near 61.8% level at 144.86.

GBP/USD break the rising trendline on daily chart early today. The pair currently testing the 13th November low after closing below 13-day EMA on 4 hour chart. Next support is the white trendline connecting the 5th and 12th November lows. If the pair sustain below that support, we might see the pair goes to 1.6280/90 support (lime green).
Just a quick update for GBP/JPY and GBP/USD hourly chart setup before the week starts. GBP/USD reachead 50% retracement after went as high as 1.6843 on Monday.The pair bounced from the falling trendline on Friday and I plan to enter on trendline breakout. GBP/JPY had a similar move with GBP/USD, tested the resistance on Monday, tested the support after that, and closed near the week open. Anyway, the is the same with GBP/USD. Thats all. Have a nice day guys! oh one more thing, I can't upload the chart from blogger so click the links below ok..
http://pic.gd/ae7dfd
http://pic.gd/1b6e30


The recovery continued as high as 153.22 (near 23.6% Fib level of 118.80 to 163.06) before closing the week at 150.04, below 200 day EMA and neckline, and formed a shooting star candle. A top might be in place and the pair could test 139.7 again before 118.8, following the downtrend from 251.08 high.
However, it is still uptrend in smaller time frame and I suspect choppy movement toward the first retracement target at 146.46 (50% fib of 139.7 to 153.22), which should be provided by multiple trendlines below (check the hourly screenshot). Ok, have a nice weekend!


Above are GBP/JPY H4 and H1 chart. From last post, the pair finally break above resistance and has reached target - which is the range of the sideways. I drew trendline on weekly chart and this could be the time for some significant fall, at least to test the 149.35 support. Below the rising trendline on H4 chart then we can target 146.71 support near.