Showing posts with label Support. Show all posts

Wednesday, June 09, 2010

USD/CHF Short Signal


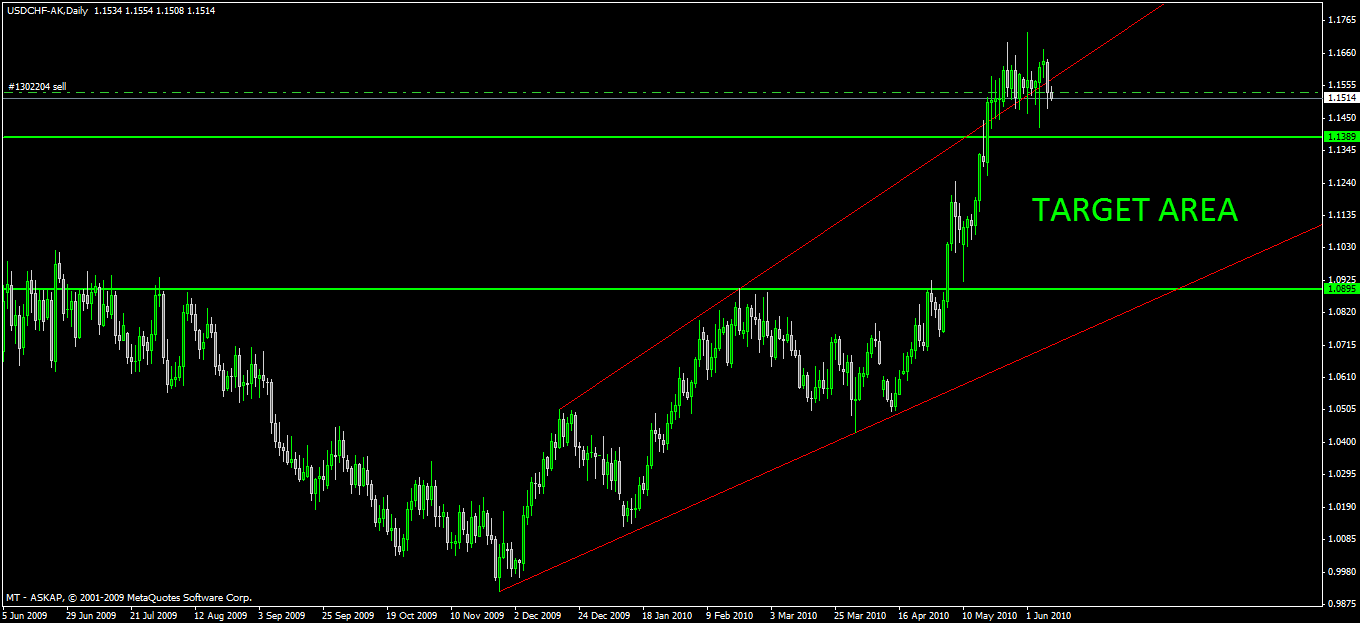
I have been watching this pair for several days now waiting for this moment. The pair has move back inside the trendlines and I have entered short position at 1.1532. If 1.1728 is the top of the fifth wave, then we should see A-B-C corrective waves. I calculate minimum and maximum movement for this and got 2 lines there (see pic). Between those lines is our target area. That is all guys. Happy pippin!

Sunday, March 21, 2010

GBP/JPY Break H4 Trendline


The pair reach 61.8% retracement of 143.59 to 132.00 at 139.16. It reversed since and made a nice bearish candle on weekly chart. It also break H4 trendline and the pair might continue the down trend. Support levels can be seen around 135.16 first and 133.88 next before testing 132.00. As for risk, I think 38.2 level (136.43).

Friday, March 12, 2010

GBP/JPY Update


The retracement from Friday reach 61.8% and formed a double bottom. It has been moving up since. First target it the 50% level of the 5-wave down from 143.59 to 132.00 at 137.80. Stop loss around 136.

Tuesday, February 23, 2010

Chart Setup GBPJPY, EURUSD, and GBPUSD


Above are chart setup for GBP/JPY, GBPUSD, and EURUSD.
GBP/JPY downtrend may continue this week after 2-week retracement from 138.26 and went as high as 143.63 last week. I currently shorting this pair as long it stays below the falling trendline.

GBP/USD broke 1.5707 support area on weekly chart. 100% projection is near 78.6% retracement or the green horizontal line (see chart).

EUR/USD reached 61.8% retracement which is the target from the previous post. The pair may have completed the third wave from 1.5144 top at this level. However the outlook is still bearish in daily chart as long the channel remain intact. First resistance is the last week high around 1.3780.

Thursday, February 11, 2010

EUR/USD Reach Target


The pair has reach the target mentioned in previous post and found support at 1.3582. The pair retrace back to 1.38 since the open of this week market. It has not been clear yet of the retracement pattern this time, but I think the down trend ain't over just yet. On daily chart above, we can see that 1.3800 area was a serious support level around June last year, and even at weekly chart we can see a clear break from 1.3800. First target is the 61.8% retracement of 1.2457 to 1.5144 at 1.3483. You can see other levels in the chart above.

Monday, December 07, 2009

GBP/JPY Reached 23.6% Retracement


The pair has retraced 23.6% of 139.26 to 149.14 at 146.81. There are several support level here, broken trendline and 38.2% level of 118.80 to 163.06 (blue Fib) at 146.16. Break of these support levels should target 50% and 61.8% level. On the upside, first resistance is the falling trendline before testing 149.14 high.

Saturday, December 05, 2009

GBP/JPY Near 113%, Cable Still In Range


Above is GBP/JPY 4 hour chart. It is pretty much the same with the one from the previous post. As expected, the pair went to 143.74 and tested 141 support again. However, it failed to break 141 area and reversed instead. The pair broken several resistance and now near 113% (yellow Fib) following the US unemployment release on Friday. Break of 113% (149.38) could bring the pair up to 23.6% level of 118.80 to 163.06 at 152.62. Failure to break this trendline could bring retracement to 146.20 area first, but I'll update on this since we don't see any sign of the top.

GBP/USD
Cable had a perfect negative correlation with GBP/JPY after the NFP release. The pair broke the support trendline and reached 1.6430 (38.2% level) before closing the week at 1.6474. I expect another ranging moves between that S/R lines (see chart) next week, at least until UK interest rate announcement.

Sunday, October 18, 2009

USD/JPY Hourly Setup


This is my USD/JPY setup on hourly chart from last Friday. The pair has failed to sustain above 23.6% level of 101.43 to 88.00 (blue Fibonacci). Target for the retracement is around 90.33 support, which I suspect will bring another round for consolidation if not break below. Check the screenshot.

Friday, October 16, 2009

GBP/JPY 50% Fib at 151.38


Here is another setup on GBP/JPY. Above is the daily chart. Key S/R is at 146.72, below that level then the outlook change to bearish again. I entered long targeting 151.38 (50% Fib) and 154.14 (61.8% Fib). Ok that is all for now. Happy Trading!

Tuesday, October 06, 2009

Remain Bearish Below 1.604


Above is GBP/USD daily chart. The pair is in consolidation after the huge fall to 1.5769. I'll keep my 1.5272 target as long the pair maintain below 1.604 in daily chart. However, support can be seen at 1.5769 and 1.569 (38.2% retracement). Break above 1.604 will target 1.6125 (30 Sept. high) and 1.6206 (23.6% retracement).

Monday, September 28, 2009

Reached 141 Target, 135.71 Next

GBP/JPY H4 Chart


GBP/JPY finally reached the 141 area target which is the 50% retracement of 118.80 to 163.06. The pair actually reached as low as 139.71, slightly breached the 200% Fibonacci extension of a-b-c. At the moment, the pair is trying to break its 23.6% retracement of 150.36 to 139.71 at 142.23 while 38.2% and 50% retracement levels are at 143.78 and 145.03 respectively. After so much pips down, a retracement toward 145 is very likely, although I will wait until it breaks current resistance. The outlook for GBPJPY is still bearish with 135.71 (61.8% retracement) as target after breaking 139.71 current low.


Cable Next Support At 1.5810

GBP/USD H1 Chart

GBP/USD D1 Chart


Above is Cable D1 chart. Since last post, the pound kept on losing against the yen following the break of 1.6130 support area. It reached 1.5915 on Friday and trade in 130 pips range to 1.6045. I add Fibonacci retracement from 1.6467 to 1.5915 (H1 chart) and the 38.2% and 50% level appear near the resistance trendlines. As for support levels, 100% projection of AB from C is shown in D1 chart, while the 100% projection from B is near the 161.8% projection and 50% Fibo of 1.3502 to 1.7042 at 1.5272. Trading plan for the week is still the same, selling GBP at resistance or support breakout, at least until 1.6100 area is breach. Another thing to consider is the NFP on Friday as sometimes the market become choppy prior to the release. Have a nice trading week :)


Sunday, September 27, 2009

USD/JPY Is On Its Way To Test 87.12

USD/JPY H1 Chart

USD/JPY H4 Chart


USD/JPY MN Chart


Above are USD/JPY monthly, 4 hour, and hourly charts. Since the previous analysis, the pair retraced as high as 92.53 before breaking 90 key support level. I added new channels for the pair as shown in 4 hour chart and H1 chart, and trendlines in monthly chart. The pair bounced and stay within 89.51 and 89.93 range before closing at 89.62 on Friday. I suggest careful approach to enter short position (wait for the break) in case of strong buying on the weak dollar. However, the direction is crystal clear on higher time frames with first support at 87.12 and 79.75 (1995 low) after that.


Thursday, September 24, 2009

The Sterling Reach Support Area vs. Yen And Dollar


Above are Cable and GBP/JPY 4 hour charts. The British Pound had retraced and resume the fall against the Dollar and Yen since my last post. I have closed all positions now. A bounce is expected, but should be within the channel and below the broken support trendline (see charts). Below are the screenshots for both pairs before the drop (I intended to post the analysis before on Asian market but my connection failed me ;P). And don't forget to check my previous posts for mid-term downtrend target ok!


Tuesday, September 22, 2009

Cable And USD/JPY Retracement Analysis


Above is Cable 4 hour chart. The pair managed to touch the neckline/support before closing above 23.6% Fibo level again. A retracement for 50% of 'e' to 'f' is likely to happen. However, the pair need to get back inside the broken channel first. Other wise, clear break below neckline will surely trigger massive selling toward 1.569 (38.2% Fibo) and 1.5272 (50% Fibo).


As for USD/JPY, it managed to closed above 50 EMA after an unconvincing channel break late Friday last week. The pair went as high as 92.53 before bounced back to 92 area. If the first correction wave 'a' has finished at 92.53, wave 'b' is expected until 50% to 61.8% Fibo retracement of wave 'a' before completing the third and final correction wave.


Saturday, September 19, 2009

Pound Still Under Pressure, Break Below Trendline

GBP/JPY H4 Chart


GBP/USD H4 Chart

Above are GBP/JPY and Cable 4 hour chart. I added a position for each pair following those breakout signals. Target for GBP/JPY is the 161.8% Fibonacci Extension, around 146.6. As for Cable, I plan to take profit at neckline area, and then open another position if the neckline breaks. However, I suspect strong buying at those target area. Anyway, 3 and a half hours left until the market close, and I don't think those pairs will reach the target today. So we'll see how they goes next week. Have a great weekend and Happy Idul Fitri! :)

Friday, September 18, 2009

USD/JPY Touched Resistance Channel/Trendline


Above is USD/JPY 4 hour chart. Strong buying at 90.20 area sent the pair back to its previous level around 91.60 before closing below 50 EMA and within the downtrend channel. 15 minutes to candle close, the pair seems to trapped between the channel and a broken trendline below. Volatility is low until a breakout occurs. 91.72 (50% Fibo) could trigger another selling if the pair breaks the resistance trendline. I the opposite, USD/JPY should test 90.20 support again.

Cable Break Below, Target @ 1.6325


Above is GBP/USD 4 hour chart. The pair break its trendline after making spikes in last 3 candles. I shorted it for 1.632 area (AB projection from C), about 120 pips from current price. There are several support actually before the 1.632 which are the Fibonacci retracement levels of 1.6113 (September 1st low) to 1.6741 (September 11th high). Current high at 1.6568 will be the stop loss area.

Wednesday, September 16, 2009

1st Target Reached, 146 Next


Above is GBP/JPY 4 hour chart. The pound lose further since my last post and reached 1st target at 149.4 area, 149.44 to be precise. The bearish movement could continue today following the trendline break (see chart). However, the pair must close below 149.40 support first. Furthermore, 161.8% extension of the last movement (1-2-3) is near the second target mentioned in previous post, which is around 146. See the screenshot for support levels. Happy trading :)